Autoscaling infrastructures
Autoscaling-DataAvenue
This tutorial aims to demonstrate the scaling capabilities of Occopus. With this solution applications can automatically scale without user intervention in a predefined scaling range to guarantee that the application always runs at the optimum level of resources.
The tutorial builds a scalable architecture framework with the help of Occopus and performs the automatic scaling of the application based on Occopus and Prometheus (a monitoring tool). The scalable architecture framework can be seen in Figure 1.
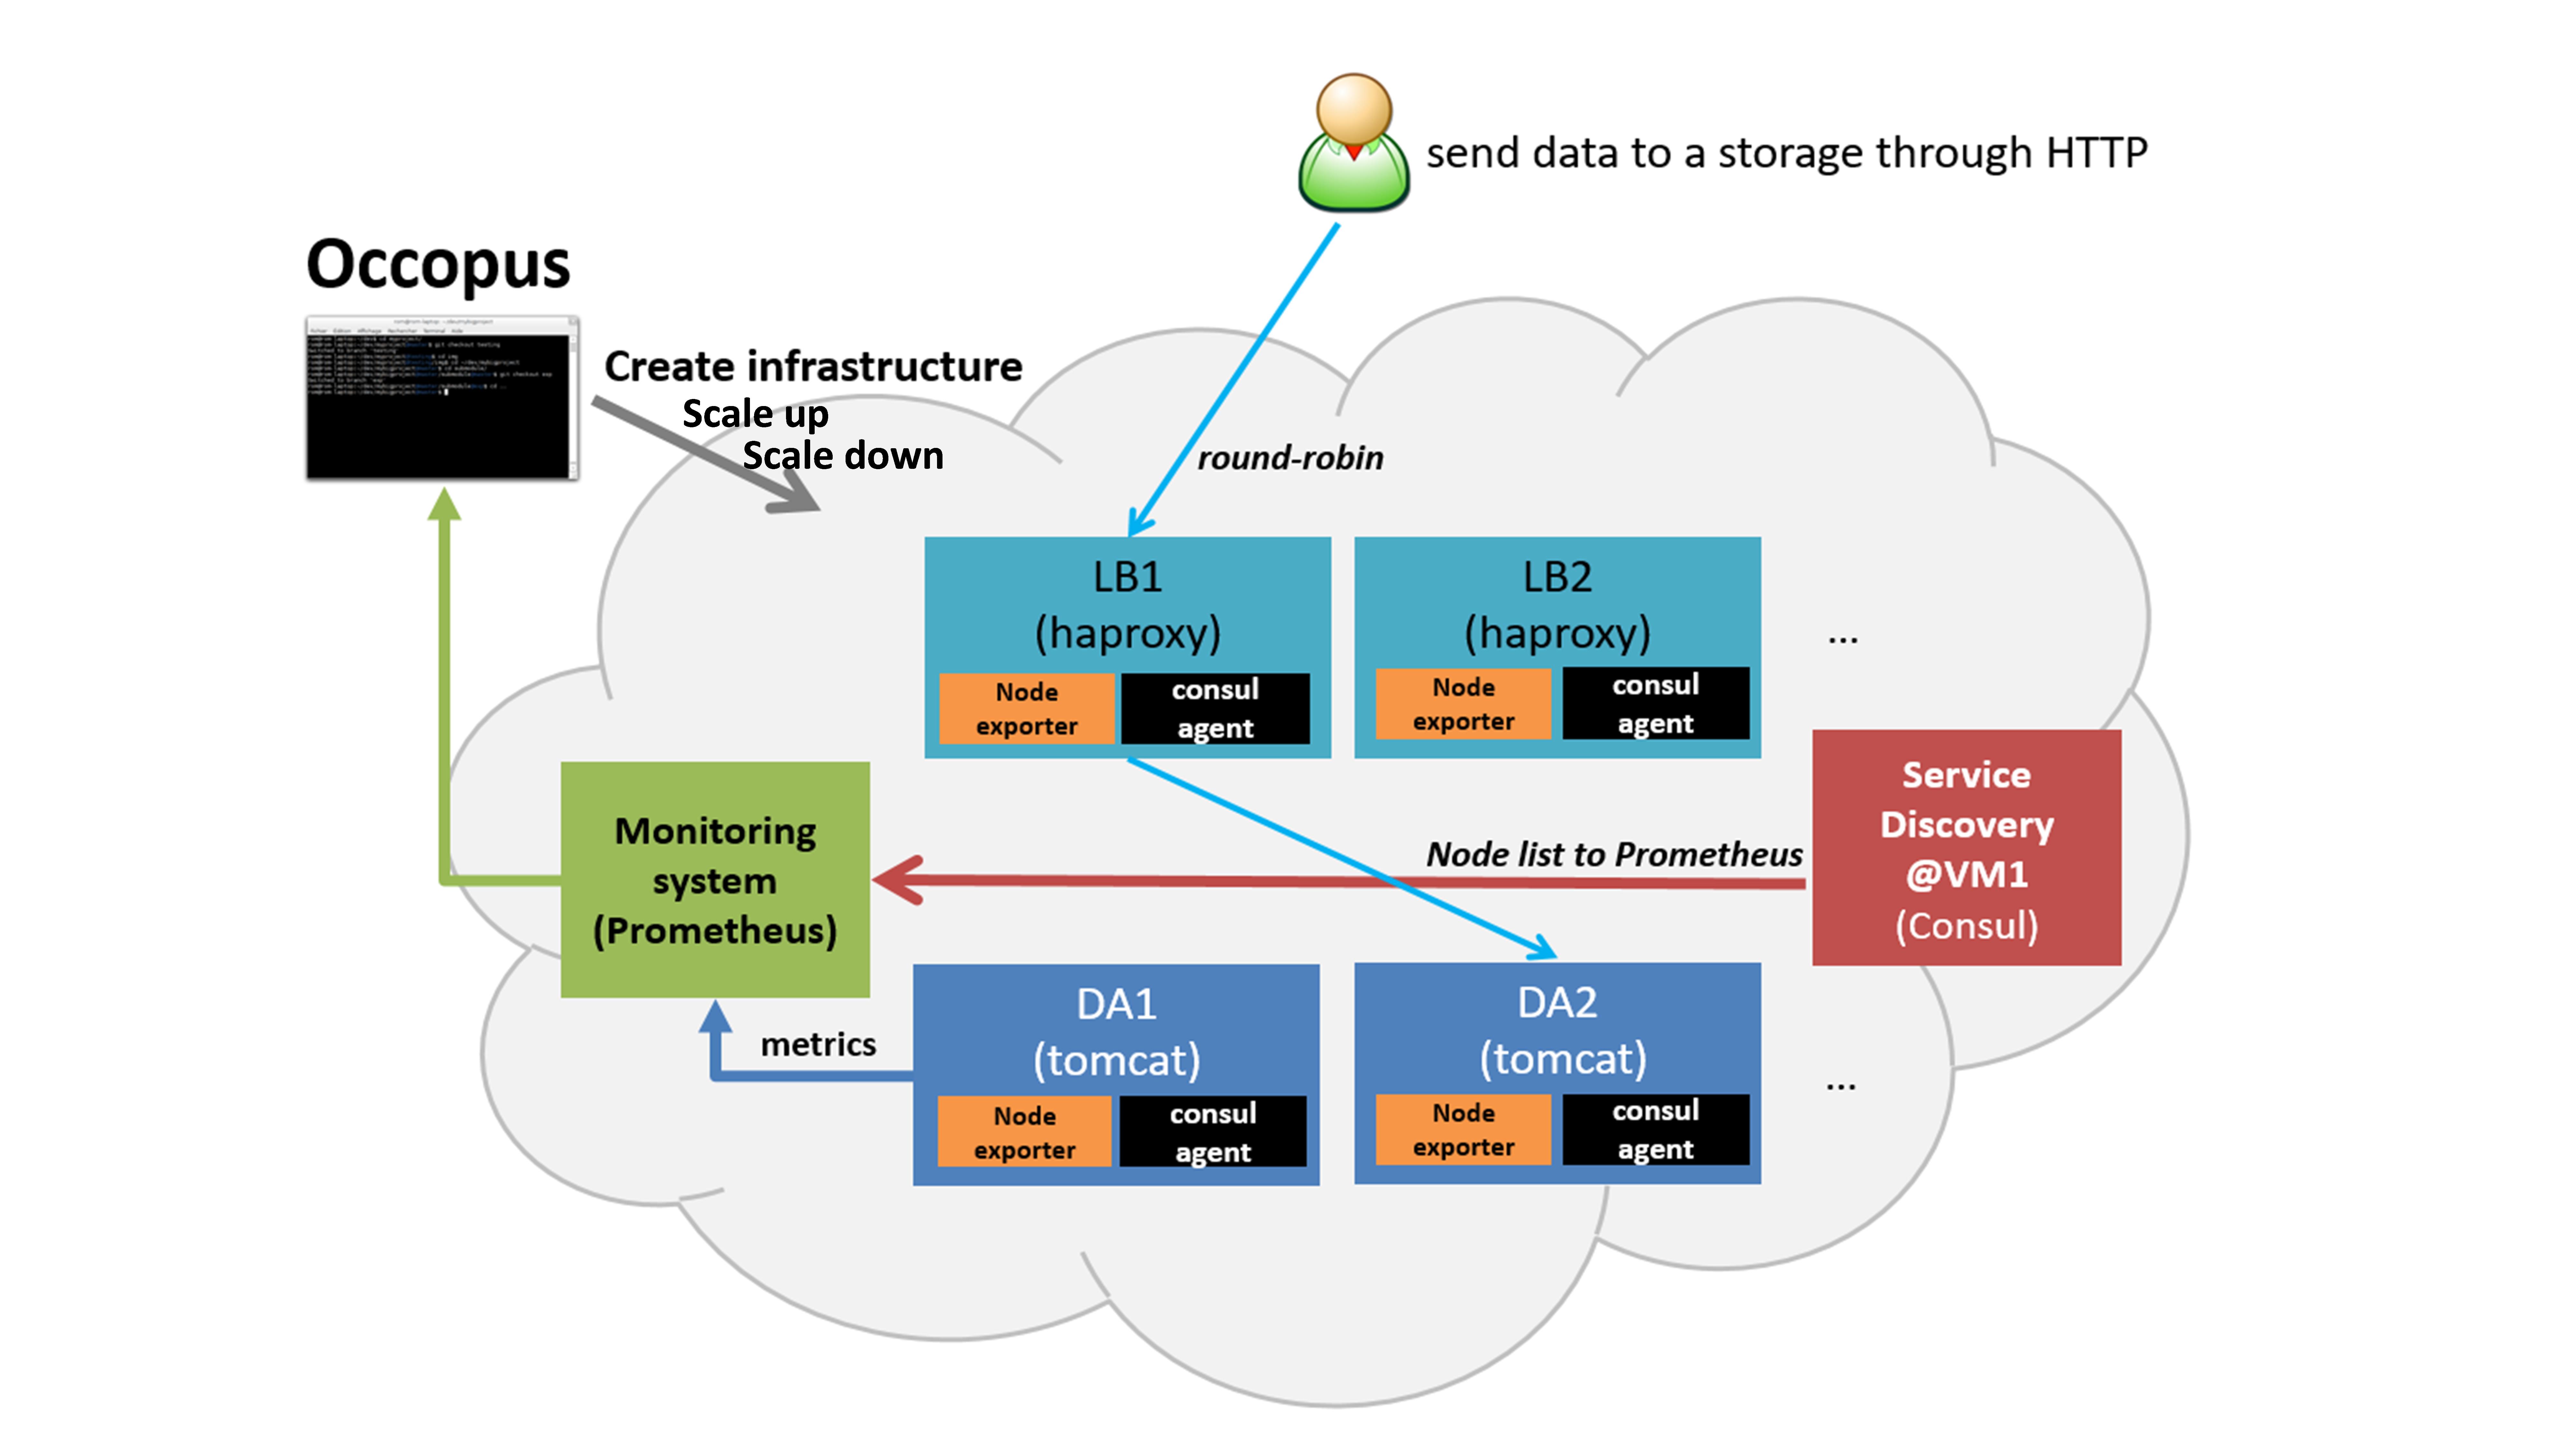
Figure 1. Scalable architecture framework
The scalable architecture framework consists of the following services:
Cloud orchestrator and manager: Occopus
Application node: Data Avanue (DA)
Service discovery: Consul
Load balancer: haproxy
Monitor: Prometheus
In this infrastructure, nodes are discovered by Consul, which is a service discovery tool also providing DNS service and are monitored by Prometheus, a monitoring software. Prometheus supports alert definitions which later will help you write custom scaling events.
In this autoscaling example we implemented a multi-layered traditional load-balancing schema. On the upper layer, there are load balancer nodes organised into a cluster and prepared for scaling. The load balancer cluster is handling the load generated by secured http transfer (https) between the client and the underlying application. The application is also organised inside a scalable cluster to distribute the load generated by serving the client requests. In this demonstration architecture, the Data Avenue (DA) service was selected to be the concrete application. Notice that other applications can easily replace the DA service and by changing the concrete application the scalable architecture template can support a large set of different applications. The DA service here implements data transfer between the client and a remote storage using various protocols (http, sftp, s3, …). For further details about the software, please visit the Data Avenue website . Finally, in the lowest layer there is a Database node (not shown in Figure 1) required by the instances of Data Avenue to store and retrieve information (authentication, statistics) for their operation.
The monitor service Prometheus collects runtime information about the work of the DA services. If DA services are overloaded Prometheus instructs Occopus to scale up the number of DA services by deploying a new DA service in the cloud. The new DA service will be attached and configured the same way as it was done for the previously deployed DA services. If the DA services are underloaded Prometheus instructs Occopus to scale down the number of DA services. (In fact, the same scale up and down operations can be applied for the load balancer services, too.)
In case, this architecture fits to your need, you may replace the Data Avenue (with its Database node) with your own application. As a result, you will have a multi-level load-balancing infrastructure, where both load balancer nodes and application servers are dynamically scaled up and down depending on the load the corresponding cluster has.
Features
using Prometheus to monitor nodes and create user-defined scaling events
using load balancers to share system load between data nodes
using Consul as a DNS service discovery agent
using data nodes running the application
Prerequisites
accessing a cloud through an Occopus-compatible interface (e.g. EC2, Azure, Nova, etc.)
target cloud contains a base 14.04 ubuntu OS image with cloud-init support (image id, instance type)
start Occopus in Rest-API mode ( occopus-rest-service )
Download
You can download the example as tutorial.examples.autoscaling-dataavenue .
Steps
Open the file
nodes/node_definitions.yamland edit the resource section of the nodes labelled bynode_def:you must select an Occopus compatible resource plugin
you can find and specify the relevant list of attributes for the plugin
you may follow the help on collecting the values of the attributes for the plugin
you may find a resource template for the plugin in the resource plugin tutorials
The downloadable package for this example contains a resource template for the EC2 plugin.
Optionally, edit the
infra_as_dataavenue.yamlinfrastructure descriptor file. Set the following attributes:scalingis the interval in which the number of nodes can change (min,max). You can change da and lb nodes or leave them as they are.
- &DA_cluster # Node Running your application
  name: da
  type: da
  scaling:
    min: 1
    max: 10
Important
Keep in mind that Occopus has to start at least one node from each node type to work properly!
Optionally, you can edit the
nodes/cloud_init_da.yamlnode descriptor file. If you wish, you can replace the actually implemented Grid Data Avenue webapplication with your own one. Be careful, when modifying this example!This autoscaling project scales the infrastructure over your application while you can run any application on it. You have to put your application code into the cloud_init_da.yaml file and make sure it starts automatically when the node boots up. This way every data node will run your application and load balancers will share the load between them. This solution fits to web applications serving high number of incoming http requests.
Note
For detailed explanation on cloud-init and its usage, please read the cloud-init documentation!
Optionally, edit the
nodes/cloud_init_prometheus.yamlnode descriptor file’s “Prometheus rules” section in case you want to implement new scaling rules. The actually implemented rules are working well and can be seen below.{infra_id}is a built in Occopus variable and every alert has to implement it in their Labels!nodeshould be set to da or lb depending on which type of node the alerts should work.
   lb_cpu_utilization = 100 - (avg (rate(node_cpu{group="lb_cluster",mode="idle"}[60s])) * 100)
   da_cpu_utilization = 100 - (avg (rate(node_cpu{group="da_cluster",mode="idle"}[60s])) * 100)

ALERT da_overloaded
  IF da_cpu_utilization > 50
  FOR 1m
  LABELS {alert="overloaded", cluster="da_cluster", node="da", infra_id="{{infra_id}}"}
  ANNOTATIONS {
  summary = "DA cluster overloaded",
  description = "DA cluster average CPU/RAM/HDD utilization is overloaded"}
ALERT da_underloaded
  IF da_cpu_utilization < 20
  FOR 2m
  LABELS {alert="underloaded", cluster="da_cluster", node="da", infra_id="{{infra_id}}"}
  ANNOTATIONS {
  summary = "DA cluster underloaded",
  description = "DA cluster average CPU/RAM/HDD utilization is underloaded"}
Important
Autoscaling events (scale up, scale down) are based on Prometheus rules which act as thresholds, let’s say scale up if cpu usage > 80%. In this example you can see the implementation of a cpu utilization in your da-lb cluster with some threshold values. Please, always use infra_id in you alerts as you can see below since Occopus will resolve this variable to your actual infrastructure id. If you are planning to write new alerts after you deployed your infrastructure, you can copy the same infrastructure id to the new one. Also make sure that the “node” property is set in the Labels subsection, too. For more information about Prometheus rules and alerts, please visit: https://prometheus.io/docs/alerting/rules/
Edit the “variables” section of the
infra_as_dataavenue.yamlfile. Set the following attributes:occopus_restservice_ipis the ip address of the host where you will start the occopus-rest-serviceoccopus_restservice_portis the port you will bind the occopus-rest-service to
occopus_restservice_ip: "127.0.0.1"
occopus_restservice_port: "5000"
Components in the infrastructure connect to each other, therefore several port ranges must be opened for the VMs executing the components. Clouds implement port opening various way (e.g. security groups for OpenStack, etc). Make sure you implement port opening in your cloud for the following port ranges:
Protocol
Port(s)
Service
TCP
22
SSH
TCP
8300
(Consul) TCP Server RPC. This is used by servers to handle incoming requests from other agents.
TCP and UDP
8301
(Consul) This is used to handle gossip in the LAN. Required by all agents.
TCP and UDP
8302
(Consul) This is used by servers to gossip over the WAN to other servers.
TCP
8400
(Consul) CLI RPC. This is used by all agents to handle RPC from the CLI.
TCP
8500
(Consul) HTTP API. This is used by clients to talk to the HTTP API.
TCP and UDP
8600
(Consul) DNS Interface. Used to resolve DNS queries.
TCP
8600
(Consul) DNS Interface. Used to resolve DNS queries.
TCP
9090
Prometheus
TCP
8080
Data Avenue
TCP
9093
Alertmanager
Make sure your authentication information is set correctly in your authentication file. You must set your authentication data for the
resourceyou would like to use. Setting authentication information is described here.Load the node definitions into the database.
Important
Occopus takes node definitions from its database when builds up the infrastructure, so importing is necessary whenever the node definition or any imported (e.g. contextualisation) file changes!
occopus-import nodes/node_definitions.yaml
Start Occopus in REST service mode:
occopus-rest-service --host [occopus_restservice_ip] --port [occopus_restservice_port]
Use
ipandportvalues as defined in the infrastructure description! Alternatively, use 0.0.0.0 for the host ip.Start deploying the infrastructure through the Occopus service:
curl -X POST http://[occopus_restservice_ip]:[occopus_restservice_port]/infrastructures/ --data-binary @infra_as_dataavenue.yaml
To test the down-scaling mechanism scale up manually the da nodes through the occopus REST interface and after a few minutes you can observe that the newly connected nodes will be automatically removed because the underloaded alert is firing. You can also check the status of your alerts during the testing at
[PrometheusIP]:9090/alerts.curl -X POST http://[occopus_restservice_ip]:[occopus_restservice_port]/infrastructures/[infrastructure_id]/scaleup/da
Important
Depending on the cloud you are using for you virtual machines it can take a few minutes to start a new node and connect it to your infrastructure. The connected nodes are present on prometheus’s Targets page.
To test the up-scaling mechanism put some load on the data nodes with the command below. Just select one of your LB node and generate load on it with running the command below in a few copy. After a few minutes the cluster will be overloaded, the overloaded alerts will fire in Prometheus and a new da node will be started and connected to your cluster. Also, if you stop sending files for a while, the overloaded alerts will fire in Prometheus and one (or more) of the da nodes will be shut (scaled) down.
To query the nodes and their ip addresses, use this command:
curl -X GET http://[occopus_restservice_ip]:[occopus_restservice_port]/infrastructures/[infrastructure_id]
Once, you have the ip of the selected LB node, generate load on it by transferring a 1GB file using the command below. Do not forget to update the placeholder!
curl -k -o /dev/null -H "X-Key: 1a7e159a-ffd8-49c8-8b40-549870c70e73" -H "X-URI:https://autoscale.s3.lpds.sztaki.hu/files_for_autoscale/1GB.dat" http://[LB node ip address]/blacktop3/rest/file
To check the status of alerts under Prometheus during the testing, keep watching the following url in your browser:
http://[prometheus node ip]:9090/alerts
Important
Depending on the cloud you are using for you virtual machines it can take a few minutes to start a new node and connect it to your infrastructure. The connected nodes are present on prometheus’s Targets page.
Finally, you may destroy the infrastructure using the infrastructure id.
curl -X DELETE http://[occopus_restservice_ip]:[occopus_restservice_port]/infrastructures/[infra id]
Autoscaling-Hadoop cluster
This tutorial aims to demonstrate the scaling capabilities of Occopus. With this solution applications can automatically scale without user intervention in a predefined scaling range to guarantee that the application always runs at the optimum level of resources.
The tutorial builds a scalable Apache Hadoop infrastructure with the help of Occopus and performs the automatic scaling of the application based on Occopus and Prometheus (a monitoring tool). It contains a Hadoop Master node and Hadoop Slave worker nodes, which can be scaled up or down. To register Hadoop Slave nodes Consul is used.
- Features
creating two types of nodes through contextualisation
utilising health check against a predefined port
using Prometheus to scale Hadoop Slaves automatically
using Consul as a DNS service discovery agent
- Prerequisites
accessing a cloud through an Occopus-compatible interface (e.g. EC2, Azure, Nova, etc.)
target cloud contains a base 14.04 ubuntu OS image with cloud-init support (image id, instance type)
generated ssh key-pair (or for testing purposes one is attached)
start Occopus in Rest-API mode ( occopus-rest-service )
Download
You can download the example as tutorial.examples.autoscaling-hadoop.
Steps
Open the file
nodes/node_definitions.yamland edit the resource section of the nodes labelled bynode_def:.you must select an Occopus compatible resource plugin
you can find and specify the relevant list of attributes for the plugin
you may follow the help on collecting the values of the attributes for the plugin
you may find a resource template for the plugin in the resource plugin tutorials
The downloadable package for this example contains a resource template for the Nova plugin.
Important
Do not modify the values of the contextualisation and the health_check section’s attributes!
Important
Do not specify the server_name attribute for slaves so they are named automatically by Occopus to make sure node names are unique!
Note
If you want Occopus to monitor (health_check) your Hadoop Master and it is to be deployed in a different network, make sure you assign public (floating) IP to the Master node.
Optionally, edit the
nodes/cloud_init_hadoop_master.yamlnode descriptor file’s “Prometheus rules” section in case you want to implement new scaling rules. The actually implemented rules are working well and can be seen below.{infra_id}is a built in Occopus variable and every alert has to implement it in their Labels!
hd_cpu_utilization = 100 - (avg (rate(node_cpu{group="hd_cluster",mode="idle"}[60s])) * 100)
hd_ram_utilization = (sum(node_memory_MemFree{job="hd_cluster"}) / sum(node_memory_MemTotal{job="hd_cluster"})) * 100
hd_hdd_utilization = sum(node_filesystem_free{job="hd_cluster",mountpoint="/", device="rootfs"}) / sum(node_filesystem_size{job="hd_cluster",mountpoint="/", device="rootfs"}) *100

ALERT hd_overloaded
  IF hd_cpu_utilization > 80
  FOR 1m
  LABELS {alert="overloaded", cluster="hd_cluster", node="hadoop-slave", infra_id="{{infra_id}}"}
  ANNOTATIONS {
  summary = "HD cluster overloaded",
  description = "HD cluster average CPU utilization is overloaded"}
ALERT hd_underloaded
  IF hd_cpu_utilization < 20
  FOR 2m
  LABELS {alert="underloaded", cluster="hd_cluster", node="hadoop-slave", infra_id="{{infra_id}}"}
  ANNOTATIONS {
  summary = "HD cluster underloaded",
  description = "HD cluster average CPU utilization is underloaded"}
Important
Autoscaling events (scale up, scale down) are based on Prometheus rules which act as thresholds, let’s say scale up if cpu usage > 80%. In this example you can see the implementation of a cpu utilization in your Hadoop cluster with some threshold values. Please, always use infra_id in you alerts as you can see below since Occopus will resolve this variable to your actual infrastructure id. If you are planning to write new alerts after you deployed your infrastructure, you can copy the same infrastructure id to the new one. Also make sure that the “node” property is set in the Labels subsection, too. For more information about Prometheus rules and alerts, please visit: https://prometheus.io/docs/alerting/rules/
Edit the “variables” section of the
infra_as_hadoop.yamlfile. Set the following attributes:occopus_restservice_ipis the ip address of the host where you will start the occopus-rest-serviceoccopus_restservice_portis the port you will bind the occopus-rest-service to
occopus_restservice_ip: "127.0.0.1"
occopus_restservice_port: "5000"
Components in the infrastructure connect to each other, therefore several port ranges must be opened for the VMs executing the components. Clouds implement port opening various way (e.g. security groups for OpenStack, etc). Make sure you implement port opening in your cloud for the following port ranges:
Protocol
Port(s)
Service
TCP
22
SSH
TCP
8025
(Hadoop) Resource Manager
TCP
8042
(Hadoop) NodeManager
TCP
8080
…
TCP
8088
(Hadoop) Resource Manager WebUI
TCP
8300-8600
…
TCP
9000
…
TCP
9090
…
TCP
9093
…
TCP
50000-51000
…
Make sure your authentication information is set correctly in your authentication file. You must set your authentication data for the
resourceyou would like to use. Setting authentication information is described here.Update the number of Hadoop Slave worker nodes if necessary. For this, edit the
infra-occopus-hadoop.yamlfile and modifiy the min and max parameter under the scaling keyword. Scaling is the interval in which the number of nodes can change (min, max). Currently, the minimum is set to 1 (which will be the initial number at startup), and the maximum is set to 10.- &S name: hadoop-slave type: hadoop_slave_node scaling: min: 1 max: 10
Important
Important: Keep in mind that Occopus has to start at least one node from each node type to work properly and scaling can be applied only for Hadoop Slave nodes in this example!
Load the node definitions into the database. Make sure the proper virtualenv is activated!
Important
Occopus takes node definitions from its database when builds up the infrastructure, so importing is necessary whenever the node definition or any imported (e.g. contextualisation) file changes!
occopus-import nodes/node_definitions.yaml
Start Occopus in REST service mode:
occopus-rest-service --host [occopus_restservice_ip] --port [occopus_restservice_port]
Use
ipandportvalues as defined in the infrastructure description! Alternatively, use 0.0.0.0 for the host ip.Start deploying the infrastructure through the Occopus service:
curl -X POST http://[occopus_restservice_ip]:[occopus_restservice_ip]/infrastructures/ --data-binary @infra_as_hadoop.yaml
To test the down-scaling mechanism scale up manually the da nodes through the occopus REST interface and after a few minutes you can observe that the newly connected nodes will be automatically removed because the underloaded alert is firing. You can also check the status of your alerts during the testing at
[HaddopMasterIP]:9090/alerts.curl -X POST http://[occopus_restservice_ip]:[occopus_restservice_ip]/infrastructures/[infrastructure_id]/scaleup/hadoop-slave
Important
Depending on the cloud you are using for you virtual machines it can take a few minutes to start a new node and connect it to your infrastructure. The connected nodes are present on prometheus’s Targets page.
To test the up-scaling mechanism put some load on the Hadoop Slave nodes. After a few minutes the cluster will be overloaded, the overloaded alerts will fire in Prometheus and a new Hadoop Slave node will be started and connected to your cluster. Also, if you stop sending files for a while, the overloaded alerts will fire in Prometheus and one (or more) of the Hadoop Slave nodes will be shut (scaled) down.
To query the nodes and their ip addresses, use this command:
curl -X GET http://[occopus_restservice_ip]:[occopus_restservice_ip]/infrastructures/[infrastructure_id]
Once, you have the ip of the Hadoop Master node, generate load on it by executing Hadoop MapRedcue jobs. To launch a Hadoop MapReduce job copy your input and executable files to the Hadoop Master node, and perform the submission described here . To login to the Hadoop Master node use the private key attached to the tutorial package:
ssh -i builtin_hadoop_private_key hduser@[HadoopMaster ip]
To check the status of alerts under Prometheus during the testing, keep watching the following url in your browser:
http://[HadoopMasterIP]:9090/alerts
Important
Depending on the cloud you are using for you virtual machines it can take a few minutes to start a new node and connect it to your infrastructure. The connected nodes are present on prometheus’s Targets page.
You can check the health and statistics of the cluster through the following web pages:
Health of nodes:
http://[HadoopMasterIP]:50070Job statistics:
http://[HadoopMasterIP]:8088
Finally, you may destroy the infrastructure using the infrastructure id.
curl -X DELETE http://[occopus_restservice_ip]:[occopus_restservice_ip]/infrastructures/[infra id]